I wonder how many have you experienced what I had for the past 2 days. I had a phone call from my project co-ordinator stating that I might not get my degree. There has been a lot of mis-communication by the person involved in the issue. Shit Happens!! Now I have my 2nd and 3rd Review on Monday, I consider myself special, you know ;-)
I never really started to build something for my project until Thursday when I had the phone calls. I shifted all my engagements at work till Tuesday to get into the damn thing.
Scenario - I had 2 days for building a demo, 1 day for preparing the documentation, and 1 day for travel (which I generally do at night to save time).
To my own astonishment I was able to come with a demo-able something in 1 day, which I shared with some colleagues of mine to improvise on demand and fix some bugs. After around 1.5 days of work, here are some of the screen shots from the application.
# Prioritized on usage
First the Dashboard, it shows you the overall stats of the Twitter feeds and their sentiment division among Positive, Negative and Neutral. Currently I have implemented only Twitter feeds, Facebook and G+ should not take much time to implement.

Next is the Key Influencers. People who shape the conversation about your product / event / campaign. It is shown in a network form, where the center node is a picture that represents your campaign, and all other nodes represent the users. User's contribution towards the campaign denotes the higher size of the node. One of my friends suggested to improvise on this using Klout score too, seems like a very nice idea, need to see if it is possible and it would be a Kicking Ass feature if implemented.

Next comes the Realtime Twitter Dashboard. As we get in Tweets to the system, we push them to the screen so that users see what people are talking about their campaign in real time. I do not know UX or anything related to UI, but I am a freaking good user.
I know the problems user's might face and one such problem was. When I kept on adding tweets to the page in realtime, for a high frequency campaign. After around 10 - 15 min, my browser started becoming slow / non-responsive. Too much of content on page was not at all a good idea, hence now we start off with 10 tweets pre-loaded into the page and it gets updated in real time. Still there are no more than 100 tweets at the page (on either side) at any given point of time. Having the browser and page more responsive.
I am still open for any further improvements / changes by an expert.

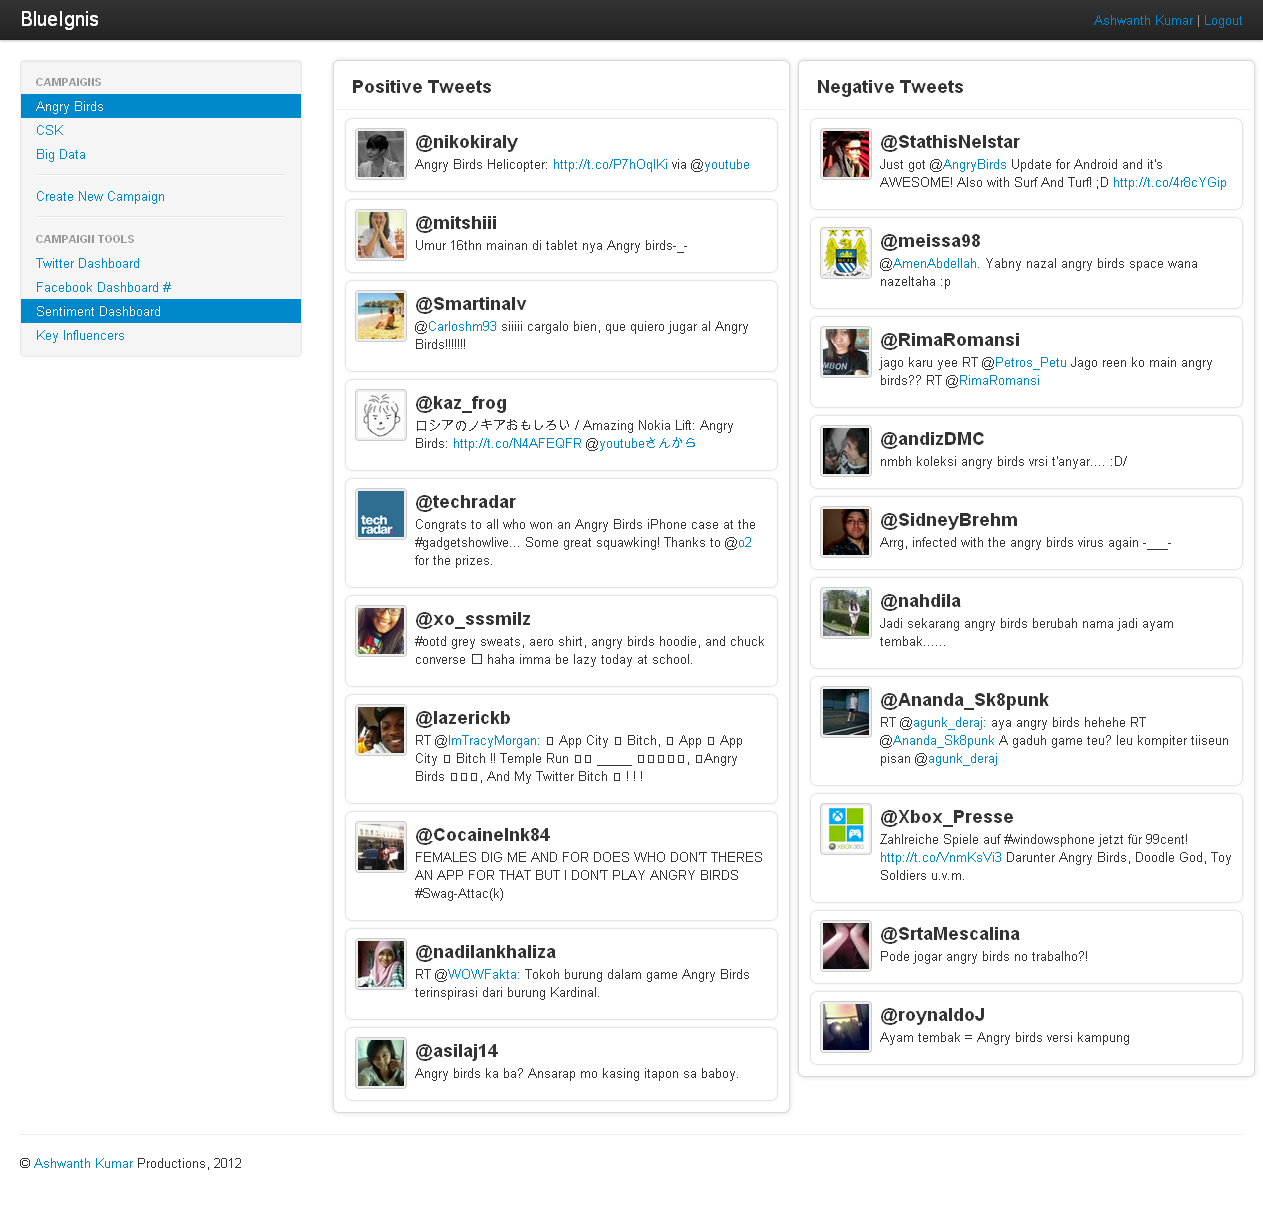
Next comes the Realtime Sentiment Dashboard - Real time feed of sentiments for the campaign. As we process the tweets as Positive / Negative they drop by into the screen in real time.

Apart from this we have a login screen and a create campaign page which helps you create campaigns. Once I am done with this documentation I really wish to spend some considerable amount of time on this to add more features and analytics to it.
Would you be interested on using it? Do you think there are additional features that you might be interested in seeing in this? UX / UI tips for the novice here? Any suggestions are always welcome and drop by a comment stating what you feel about it.
I never really started to build something for my project until Thursday when I had the phone calls. I shifted all my engagements at work till Tuesday to get into the damn thing.
Scenario - I had 2 days for building a demo, 1 day for preparing the documentation, and 1 day for travel (which I generally do at night to save time).
To my own astonishment I was able to come with a demo-able something in 1 day, which I shared with some colleagues of mine to improvise on demand and fix some bugs. After around 1.5 days of work, here are some of the screen shots from the application.
Ingredients# - PHP (as always) + MySQL + Redis + Twitter Bootstrap + jQuery +
Coke + Pressure to get a Degree (*wink*)
Coke + Pressure to get a Degree (*wink*)
# Prioritized on usage
First the Dashboard, it shows you the overall stats of the Twitter feeds and their sentiment division among Positive, Negative and Neutral. Currently I have implemented only Twitter feeds, Facebook and G+ should not take much time to implement.

Next is the Key Influencers. People who shape the conversation about your product / event / campaign. It is shown in a network form, where the center node is a picture that represents your campaign, and all other nodes represent the users. User's contribution towards the campaign denotes the higher size of the node. One of my friends suggested to improvise on this using Klout score too, seems like a very nice idea, need to see if it is possible and it would be a Kicking Ass feature if implemented.

Next comes the Realtime Twitter Dashboard. As we get in Tweets to the system, we push them to the screen so that users see what people are talking about their campaign in real time. I do not know UX or anything related to UI, but I am a freaking good user.
I know the problems user's might face and one such problem was. When I kept on adding tweets to the page in realtime, for a high frequency campaign. After around 10 - 15 min, my browser started becoming slow / non-responsive. Too much of content on page was not at all a good idea, hence now we start off with 10 tweets pre-loaded into the page and it gets updated in real time. Still there are no more than 100 tweets at the page (on either side) at any given point of time. Having the browser and page more responsive.
I am still open for any further improvements / changes by an expert.

Next comes the Realtime Sentiment Dashboard - Real time feed of sentiments for the campaign. As we process the tweets as Positive / Negative they drop by into the screen in real time.
Apart from this we have a login screen and a create campaign page which helps you create campaigns. Once I am done with this documentation I really wish to spend some considerable amount of time on this to add more features and analytics to it.
Would you be interested on using it? Do you think there are additional features that you might be interested in seeing in this? UX / UI tips for the novice here? Any suggestions are always welcome and drop by a comment stating what you feel about it.

